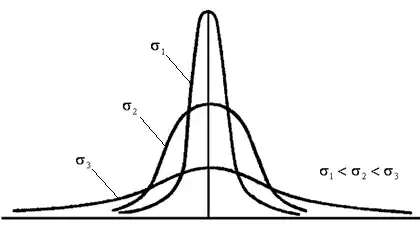
Play with complete bets on Roulette does not obey the law of large numbers on any practical timeline and carries significant solvency risk for the casino. This article focuses on evaluating the casino’s potential loss over a short-term horizon when a player places $100 complete bets on numbers in the second column.
Standard Deviation of Complete Bets
When a player places complete bets on second-column numbers (5, 8, 11, 14, 17, 20, 23, 26, 29, 32), variance and standard deviation reach their maximum. In high-stakes play, the casino faces the risk of a significant loss that must be evaluated before the game begins, and acceptable betting limits must be set accordingly.
The casino can lose whenever the dispersion range of actual results dips into negative territory. Even over a longer horizon, when 95.45% of outcomes fall within the positive range, there remains a 4.55% probability that actual results will land outside the ±2σ band. Since the distribution is symmetric, this means there is a 2.2% chance (4.55% ÷ 2) that the casino suffers a significant loss.
Consider a complete bet on number 8 at $100 per chip. The complete bet costs 40 chips ($4,000 total). EV = $10,811, SD = $8,793.
Complete 8 Breakdown ($100 chip)
| Payout | Multiplier | Chips | Numbers | Payout (x) | Probability (p) | xp | x²p | x−m | p·(x−m)² |
|---|---|---|---|---|---|---|---|---|---|
| −40 | 100 | 40 | 0–12, 22–36 | −4,000 | 0.757 | −3,027 | 12,108,108 | −3,892 | 11,462,460 |
| 392 | 8 | 39,200 | 0.027 | 1,059 | 41,530,811 | 39,308 | 41,760,199 | ||
| 32 | 7 | 3,200 | 0.027 | 86 | 276,757 | 3,308 | 295,772 | ||
| 104 | 11 | 10,400 | 0.027 | 281 | 2,923,243 | 10,508 | 2,984,333 | ||
| 32 | 5 | 3,200 | 0.027 | 86 | 276,757 | 3,308 | 295,772 | ||
| 32 | 9 | 3,200 | 0.027 | 86 | 276,757 | 3,308 | 295,772 | ||
| 104 | 10 | 10,400 | 0.027 | 281 | 2,923,243 | 10,508 | 2,984,333 | ||
| 32 | 12 | 3,200 | 0.027 | 86 | 276,757 | 3,308 | 295,772 | ||
| 176 | 16 | 17,600 | 0.027 | 476 | 8,371,892 | 17,708 | 8,475,057 | ||
| 176 | 18 | 17,600 | 0.027 | 476 | 8,371,892 | 17,708 | 8,475,057 | ||
| Totals | 40 | 37 | 1 | −108 | 77,336,216 | 77,324,529 |
SD = 8,793 Variance D = 77,324,529
The average expected result over N spins at a constant bet: EVN = (1/37) × Wager × N = $108.1 × N. Standard deviation scales as SDN = SD × √N.
Over 100 spins, the expected value is $10,811 – a mathematical average that will almost never materialize at that exact amount on such a short sample. The actual results of playing $100 complete bets on second-column numbers over 100 spins will, with 95.45% probability, fall between −$165,058 and +$186,680, and with 99.73% probability, between −$252,992 and +$274,614.
Complete 8 ($100) – Dispersion Table
| Spins (N) | EV−3σ | EV−2σ | EV | EV+2σ | EV+3σ |
|---|---|---|---|---|---|
| 100 | −252,992 | −165,058 | 10,811 | 186,680 | 274,614 |
| 200 | −351,452 | −227,094 | 21,622 | 270,338 | 394,696 |
| 500 | −535,828 | −339,200 | 54,054 | 447,308 | 643,936 |
| 1,000 | −726,111 | −448,038 | 108,108 | 664,254 | 942,327 |
| 6,500 | −1,424,146 | −715,196 | 702,703 | 2,120,602 | 2,829,551 |
| 10,000 | −1,556,950 | −677,606 | 1,081,081 | 2,839,768 | 3,719,112 |
| 26,465 | −1,430,485 | 37 | 2,861,081 | 5,722,125 | 7,152,648 |
| 30,000 | −1,325,960 | 197,107 | 3,243,243 | 6,289,379 | 7,812,447 |
| 40,000 | −951,738 | 806,950 | 4,324,324 | 7,841,699 | 9,600,386 |
| 50,000 | −493,411 | 1,472,861 | 5,405,405 | 9,337,950 | 11,304,222 |
| 59,550 | 285 | 2,146,136 | 6,437,838 | 10,729,539 | 12,875,390 |
| 70,000 | 587,994 | 2,914,518 | 7,567,568 | 12,220,617 | 14,547,142 |
| 100,000 | 2,468,624 | 5,249,353 | 10,810,811 | 16,372,268 | 19,152,997 |
The casino can expect a positive result with 95.45% probability only after 26,465 spins, and with 99.73% probability only after 59,550 spins.
At 1,000 spins, there is a 2.2% probability that the casino’s loss exceeds $448,038.
Complete bets are high-variance play that creates significant risk not only for the player but for the casino as well. When setting betting limits for complete bets, the casino must calculate potential losses and assess solvency risk over the short term.
±2σ Dispersion Range
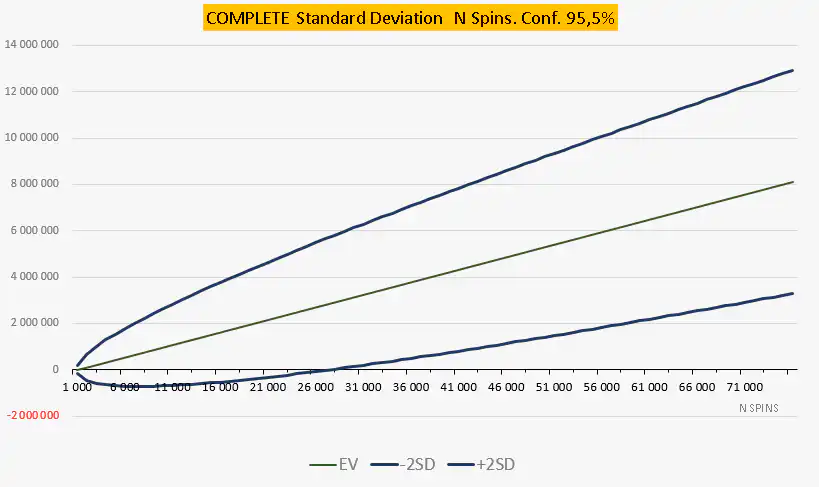
The probability that actual results of playing complete bets on number 8 fall within the ±2σ band is 95.5%. The lower bound of this band crosses zero at 26,465 spins. From that point on, the entire dispersion range sits in positive territory – the casino can expect a positive outcome with 95.5% confidence.
Before that point, standard deviation can produce negative results. At the 10,000-spin mark, results in dollar terms fall between −$677,606 and +$2,839,768. At 1,000 spins, there is a 2.1% probability (the lower tail beyond −2σ) that the casino loses an amount in the range between −$677,606 and −$1,556,950.
When spreading $100 complete bets on second-column numbers over 1,000 spins, the casino should expect, with 95.5% probability, results ranging from −$700,000 to +$2.8 million. To mitigate solvency risk, the casino should maintain reserves sufficient to cover a potential $700,000 loss.
±3σ Dispersion Range
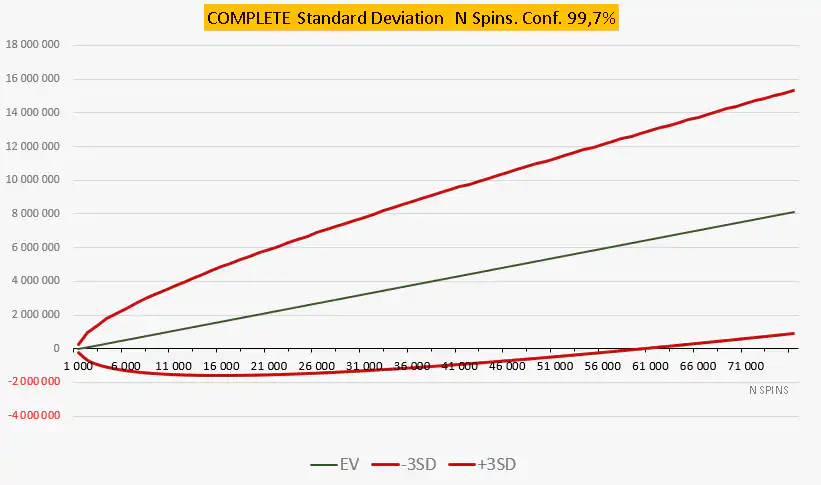
The probability that actual results fall within the ±3σ band is 99.7%. The lower bound crosses zero at 59,545 spins. From that point on, results are positive with 99.7% confidence.
Before that threshold, negative results remain possible. At 10,000 spins, the dollar range extends from −$1,556,950 to +$3,719,112. There is a 0.15% probability that the casino’s loss exceeds $1,556,950 at the 10,000-spin mark.
When spreading $100 complete bets on second-column numbers over 1,000 spins, the casino should expect, with 99.7% probability, results ranging from −$1.5 million to +$3.7 million. To cover the worst-case scenario at this confidence level, the casino should maintain reserves of $1.5 million.
Relative Dispersion
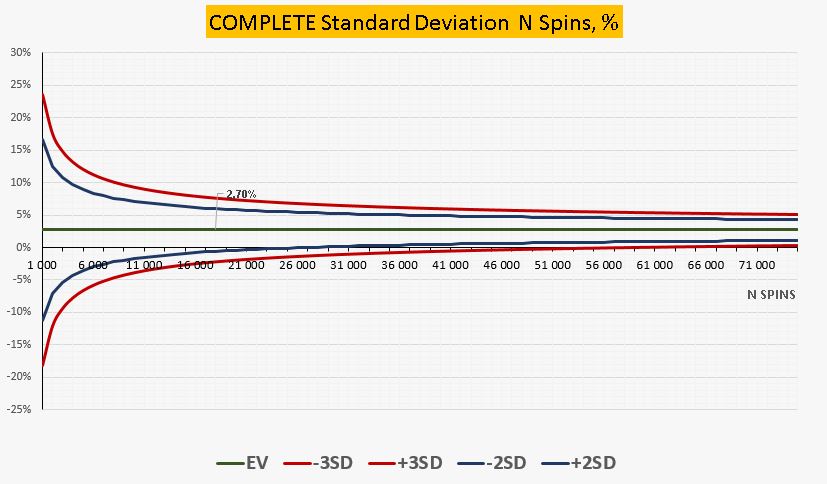
In relative terms (as a percentage of total wagered), the dispersion chart for complete bets behaves the same way as for any other Roulette bet. Expected value remains a flat 2.7% regardless of the number of spins played or the size of the bet. The SD percentage lines decay steadily: as the number of spins increases, the degree of dispersion decreases, converging toward the mathematical average of 2.7%.