- Standard Deviation and Confidence Intervals
- Calculating Standard Deviation for Roulette Bets
- Straight Up Breakdown
- Split Breakdown
- Street Breakdown
- Corner Breakdown
- Even Chances Breakdown
- Neighbours – 5 Numbers Breakdown
- Les Voisins du Zéro
- Tier
- Orphelins
- 0-Spiel
- Comparing Standard Deviation Across Bet Types
- Standard Deviation Across a Series of Spins
- How Results Spread Over Time
- Straight Up – Absolute Values
- Straight Up – Percentage of Total Wagered
- Even Chances – Absolute Values
- Even Chances – Percentage of Total Wagered
- Short-Run Risk vs. Long-Run Certainty
- Complete Bets: Maximum Variance
Every bet on the Roulette table carries the same house edge – 2.7%. What separates them is volatility. A Straight Up bet and an Even Chances bet produce identical expected value, but their standard deviations differ by a factor of six. This article calculates exactly what that difference means: for each bet type, across any sample size, with the dispersion tables and confidence bands that turn theory into operational numbers.
Standard Deviation and Confidence Intervals
Standard deviation is a quantitative measure of how far actual results scatter from the expected value. It is the square root of variance. σ² is the variance, which is expressed in squared units of the random variable. Standard deviation brings the measure back to the same scale as the original value, making it far more practical to work with.
For a normally distributed random variable:
- 99.73% of all outcomes fall within ±3σ of the mean. There is a 0.27% chance of results landing outside this range.
- 95.45% of all outcomes fall within ±2σ of the mean. There is a 4.55% chance of results landing outside this range.
- 68.3% of all outcomes fall within ±1σ of the mean. There is a 31.7% chance of any single result falling outside this range.
Calculating Standard Deviation for Roulette Bets
Standard deviation can be calculated using two equivalent formulas. The first is the definitional form – each outcome’s deviation from the mean is squared, weighted by its probability, and summed under the square root:

The second is the computational shortcut – often easier to work with in practice, as it avoids calculating the deviation for each outcome separately:

An important note: the house advantage on all Roulette bets is identical at 2.7% (1/37). Every bet on the table produces the same expected value. What differs – significantly – is the variance and standard deviation. The xP column total gives the expected result of the bet – the mathematical expectation (House Advantage). Applying these formulas to each bet type produces the following:
| Bet | Numbers | Payout | Variance (D) | Std Dev (SD) |
|---|---|---|---|---|
| Straight Up | 1 | 35:1 | 34.0804 | 5.8378 |
| Split | 2 | 17:1 | 16.5668 | 4.0702 |
| Street | 3 | 11:1 | 10.7290 | 3.2755 |
| Corner | 4 | 8:1 | 7.8101 | 2.7947 |
| Six-Line | 6 | 5:1 | 4.8912 | 2.2116 |
| Dozen | 12 | 2:1 | 1.9722 | 1.4044 |
| Even Chances | 18 | 1:1 | 0.9993 | 0.9996 |
| Les Voisins du Zéro | 17 | — | 79.5997 | 8.9219 |
| Tier | 12 | — | 71.0007 | 8.4262 |
| Orphelins | 8 | — | 98.93 | 9.9462 |
| 0-Spiel | 7 | — | 72.42 | 8.510 |
| Neighbours (5 numbers) | 5 | — | 151.47 | 12.307 |
| Complete 8 | 9 | — | 7,732.5 | 87.934 |
All bets on Roulette are equal in expected result but differ significantly in variance and standard deviation. In the calculations that follow, we use the expanded computational formula:

Straight Up Breakdown
| Outcome | Payout (x) | Probability (p) | xp | x²p |
|---|---|---|---|---|
| Lose | −1 | 0.97297 | −0.97297 | 0.97297 |
| Win | 35 | 0.02703 | 0.94595 | 33.1081 |
| Totals | 1 | −0.02703 | 34.0811 |
EV = 0.02703, D = 34.0804, SD = 5.8378.
Straight Up is by far the most volatile standard bet – its standard deviation is nearly six times higher than Even Chances. That 35:1 payout creates dramatic short-term swings that take hundreds of thousands of spins to settle into predictable territory.
Split Breakdown
| Outcome | Payout (x) | Probability (p) | xp | x²p |
|---|---|---|---|---|
| Lose | −1 | 0.94595 | −0.94595 | 0.94595 |
| Win | 17 | 0.05405 | 0.91892 | 15.6216 |
| Totals | 1 | −0.02703 | 16.5676 |
EV = 0.02703, D = 16.5668, SD = 4.0702.
Street Breakdown
| Outcome | Payout (x) | Probability (p) | xp | x²p |
|---|---|---|---|---|
| Lose | −1 | 0.91892 | −0.91892 | 0.91892 |
| Win | 11 | 0.08108 | 0.89189 | 9.81081 |
| Totals | 1 | −0.02703 | 10.7297 |
EV = 0.02703, D = 10.7290, SD = 3.2755.
Corner Breakdown
| Outcome | Payout (x) | Probability (p) | xp | x²p |
|---|---|---|---|---|
| Lose | −1 | 0.89189 | −0.89189 | 0.89189 |
| Win | 8 | 0.10811 | 0.86486 | 6.91892 |
| Totals | 1 | −0.02703 | 7.81081 |
EV = 0.02703, D = 7.8101, SD = 2.7947.
Even Chances Breakdown
| Outcome | Payout (x) | Probability (p) | xp | x²p |
|---|---|---|---|---|
| Lose | −1 | 0.51351 | −0.51351 | 0.51351 |
| Win | 1 | 0.48649 | 0.48649 | 0.48649 |
| Totals | 1 | −0.02703 | 1 |
EV = 0.02703, D = 0.9993, SD = 0.9996.
Even Chances is the lowest-variance standard bet on the layout – its SD is nearly six times smaller than Straight Up. This is the bet where actual results converge toward the expected value fastest, entering positive territory for the casino after just 5,600 spins at 95.45% confidence.
Neighbours – 5 Numbers Breakdown
| Outcome | Payout (x) | Probability (p) | xp | x²p |
|---|---|---|---|---|
| Lose | −5 | 0.86486 | −4.32432 | 21.6216 |
| Win | 31 | 0.13514 | 4.18919 | 129.865 |
| Totals | 1 | −0.13514 | 151.486 |
EV = 0.13514, D = 151.4682, SD = 12.3072.
Five Straight Up bets placed on adjacent numbers on the wheel – the highest standard deviation of any non-complete bet on the table.
Les Voisins du Zéro
Covers 17 numbers with 9 chips.
| Outcome | Chips | Numbers | Payout (x) | Probability (p) | xp | x²p |
|---|---|---|---|---|---|---|
| Lose (20 numbers) | — | — | −9 | 0.541 | −4.865 | 43.784 |
| Street 0/2/3 | 2 | 0 | 15 | 0.027 | 0.405 | 6.081 |
| 2 | 15 | 0.027 | 0.405 | 6.081 | ||
| 3 | 15 | 0.027 | 0.405 | 6.081 | ||
| Split 4/7 | 1 | 4 | 9 | 0.027 | 0.243 | 2.189 |
| 7 | 9 | 0.027 | 0.243 | 2.189 | ||
| Split 12/15 | 1 | 12 | 9 | 0.027 | 0.243 | 2.189 |
| 15 | 9 | 0.027 | 0.243 | 2.189 | ||
| Split 18/21 | 1 | 18 | 9 | 0.027 | 0.243 | 2.189 |
| 21 | 9 | 0.027 | 0.243 | 2.189 | ||
| Split 19/22 | 1 | 19 | 9 | 0.027 | 0.243 | 2.189 |
| 22 | 9 | 0.027 | 0.243 | 2.189 | ||
| Corner 25/29 | 2 | 25 | 9 | 0.027 | 0.243 | 2.189 |
| 26 | 9 | 0.027 | 0.243 | 2.189 | ||
| 28 | 9 | 0.027 | 0.243 | 2.189 | ||
| 29 | 9 | 0.027 | 0.243 | 2.189 | ||
| Split 32/35 | 1 | 32 | 9 | 0.027 | 0.243 | 2.189 |
| 35 | 9 | 0.027 | 0.243 | 2.189 | ||
| Totals | 9 | 37 | 1 | −0.243 | 92.676 |
EV = 0.243, D = 92.617, SD = 9.624.
Tier
Covers 12 numbers with 6 chips, all placed as splits.
| Outcome | Chips | Numbers | Payout (x) | Probability (p) | xp | x²p |
|---|---|---|---|---|---|---|
| Lose (25 numbers) | — | — | −6 | 0.676 | −4.054 | 24.324 |
| Split 5/8 | 1 | 5 | 12 | 0.027 | 0.324 | 3.892 |
| 8 | 12 | 0.027 | 0.324 | 3.892 | ||
| Split 10/11 | 1 | 10 | 12 | 0.027 | 0.324 | 3.892 |
| 11 | 12 | 0.027 | 0.324 | 3.892 | ||
| Split 13/16 | 1 | 13 | 12 | 0.027 | 0.324 | 3.892 |
| 16 | 12 | 0.027 | 0.324 | 3.892 | ||
| Split 23/24 | 1 | 23 | 12 | 0.027 | 0.324 | 3.892 |
| 24 | 12 | 0.027 | 0.324 | 3.892 | ||
| Split 27/30 | 1 | 27 | 12 | 0.027 | 0.324 | 3.892 |
| 30 | 12 | 0.027 | 0.324 | 3.892 | ||
| Split 33/36 | 1 | 33 | 12 | 0.027 | 0.324 | 3.892 |
| 36 | 12 | 0.027 | 0.324 | 3.892 | ||
| Totals | 6 | 37 | 1 | −0.162 | 71.027 |
EV = 0.162, D = 71.001, SD = 8.426.
Orphelins
Covers 8 numbers with 5 chips – one Straight Up and four Splits.
| Outcome | Chips | Numbers | Payout (x) | Probability (p) | xp | x²p |
|---|---|---|---|---|---|---|
| Lose (29 numbers) | — | — | −5 | 0.784 | −3.919 | 19.595 |
| Straight Up 1 | 1 | 1 | 31 | 0.027 | 0.838 | 25.973 |
| Split 6/9 | 1 | 6 | 13 | 0.027 | 0.351 | 4.568 |
| 9 | 13 | 0.027 | 0.351 | 4.568 | ||
| Split 14/17 | 1 | 14 | 13 | 0.027 | 0.351 | 4.568 |
| Splits 14/17 & 17/20 | 17 | 31 | 0.027 | 0.838 | 25.973 | |
| Split 17/20 | 1 | 20 | 13 | 0.027 | 0.351 | 4.568 |
| Split 31/34 | 1 | 31 | 13 | 0.027 | 0.351 | 4.568 |
| 34 | 13 | 0.027 | 0.351 | 4.568 | ||
| Totals | 5 | 37 | 1 | −0.135 | 98.946 |
EV = 0.135, D = 98.928, SD = 9.946.
Orphelins has the highest standard deviation among the traditional sector bets – mainly because number 17 is covered by two splits, creating a 31-unit payout that inflates the variance.
0-Spiel
Covers 7 numbers with 4 chips – one Straight Up and three Splits.
| Outcome | Chips | Numbers | Payout (x) | Probability (p) | xp | x²p |
|---|---|---|---|---|---|---|
| Lose (30 numbers) | — | — | −4 | 0.811 | −3.243 | 12.973 |
| Split 0/3 | 1 | 0 | 14 | 0.027 | 0.378 | 5.297 |
| 3 | 14 | 0.027 | 0.378 | 5.297 | ||
| Split 12/15 | 1 | 12 | 14 | 0.027 | 0.378 | 5.297 |
| 15 | 14 | 0.027 | 0.378 | 5.297 | ||
| Straight Up 26 | 1 | 26 | 32 | 0.027 | 0.865 | 27.676 |
| Split 32/35 | 1 | 32 | 14 | 0.027 | 0.378 | 5.297 |
| 35 | 14 | 0.027 | 0.378 | 5.297 | ||
| Totals | 4 | 37 | 1 | −0.108 | 72.432 |
This gives us EV = 0.108, D = 72.421, and SD = 8.510.
Comparing Standard Deviation Across Bet Types
As the tables above show, the variance and standard deviation of a Straight Up bet are dramatically higher than those of a Dozen or Even Chances bet. Playing Straight Up exclusively will produce results that deviate widely from the expected value over the short run. Playing Even Chances, on the other hand, requires far fewer spins for actual results to converge toward the mathematical expectation.
The flip side is also true: high-variance bets give players a greater chance of a significant win in the short term. Variance is a double-edged sword – it creates risk for the casino and opportunity for the player in equal measure.
Standard Deviation Across a Series of Spins
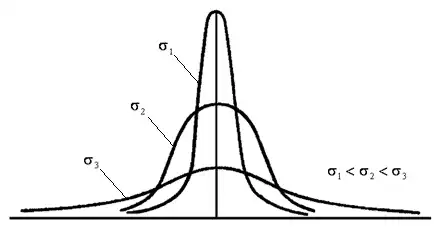
When playing equal-sized bets on a number versus on even chances across series of 100, 1,000, and 10,000 spins:
σ₁ – the dispersion of actual results at 10,000 spins – is significantly smaller than σ₂ (1,000 spins), which in turn is smaller than σ₃ (100 spins). The larger the sample, the closer actual results approach the expected value. As the number of spins increases, actual results show less dispersion relative to the mean.
How Results Spread Over Time
Straight Up – Absolute Values
| Spins (N) | SD | EV−3σ | EV−2σ | EV | EV+2σ | EV+3σ |
|---|---|---|---|---|---|---|
| 1 | 5.838 | −17.49 | −11.65 | 0.027 | 11.70 | 17.54 |
| 10 | 18.46 | −55.11 | −36.65 | 0.27 | 37.19 | 55.65 |
| 100 | 58.4 | −172.4 | −114.1 | 2.7 | 119.5 | 177.8 |
| 1,000 | 185 | −527 | −342 | 27 | 396 | 581 |
| 10,000 | 584 | −1,481 | −897 | 270 | 1,438 | 2,022 |
| 100,000 | 1,846 | −2,836 | −989 | 2,703 | 6,395 | 8,241 |
| 1,000,000 | 5,838 | 9,514 | 15,351 | 27,027 | 38,703 | 44,541 |
Straight Up – Percentage of Total Wagered
| Spins (N) | SD (%) | EV−3σ | EV−2σ | EV (%) | EV+2σ | EV+3σ |
|---|---|---|---|---|---|---|
| 1 | 583.8% | −1748.6% | −1164.9% | 2.7% | 1170.3% | 1754.1% |
| 10 | 184.6% | −551.1% | −366.5% | 2.7% | 371.9% | 556.5% |
| 100 | 58.38% | −172.4% | −114.1% | 2.7% | 119.5% | 177.8% |
| 1,000 | 18.46% | −52.7% | −34.2% | 2.7% | 39.6% | 58.1% |
| 10,000 | 5.838% | −14.8% | −9.0% | 2.7% | 14.4% | 20.2% |
| 100,000 | 1.846% | −2.8% | −1.0% | 2.7% | 6.4% | 8.2% |
| 1,000,000 | 0.584% | 1.0% | 1.5% | 2.7% | 3.9% | 4.5% |
Even Chances – Absolute Values
| Spins (N) | SD | EV−3σ | EV−2σ | EV | EV+2σ | EV+3σ |
|---|---|---|---|---|---|---|
| 1 | 1.000 | −3.00 | −2.00 | 0.001 | 2.00 | 3.00 |
| 10 | 3.161 | −9.47 | −6.31 | 0.015 | 6.34 | 9.50 |
| 100 | 10.0 | −29.8 | −19.8 | 0.145 | 20.1 | 30.1 |
| 1,000 | 31.6 | −93 | −62 | 1.45 | 65 | 96 |
| 10,000 | 100.0 | −285 | −185 | 15 | 214 | 314 |
| 100,000 | 316.1 | −803 | −487 | 145 | 777 | 1,094 |
| 1,000,000 | 999.6 | −1,547 | −547 | 1,452 | 3,452 | 4,451 |
Even Chances – Percentage of Total Wagered
| Spins (N) | SD (%) | EV−3σ | EV−2σ | EV (%) | EV+2σ | EV+3σ |
|---|---|---|---|---|---|---|
| 1 | 99.963% | −297.2% | −197.2% | 2.7% | 202.6% | 302.6% |
| 10 | 31.611% | −92.1% | −60.5% | 2.7% | 65.9% | 97.5% |
| 100 | 9.996% | −27.3% | −17.3% | 2.7% | 22.7% | 32.7% |
| 1,000 | 3.161% | −6.8% | −3.6% | 2.7% | 9.0% | 12.2% |
| 10,000 | 1.000% | −0.3% | 0.7% | 2.7% | 4.7% | 5.7% |
| 100,000 | 0.316% | 1.8% | 2.1% | 2.7% | 3.3% | 3.7% |
| 1,000,000 | 0.100% | 2.4% | 2.5% | 2.7% | 2.9% | 3.0% |
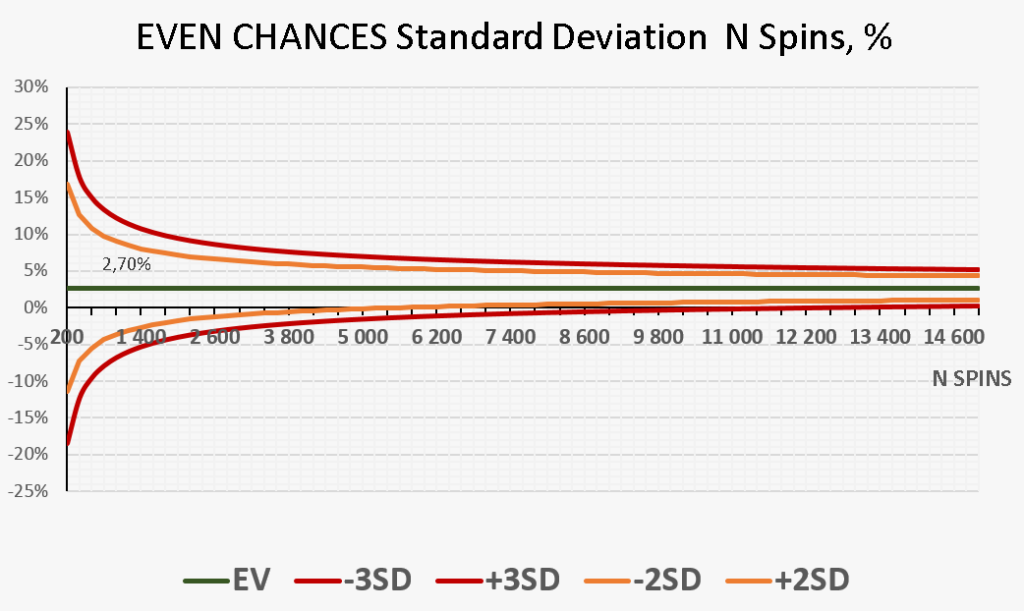
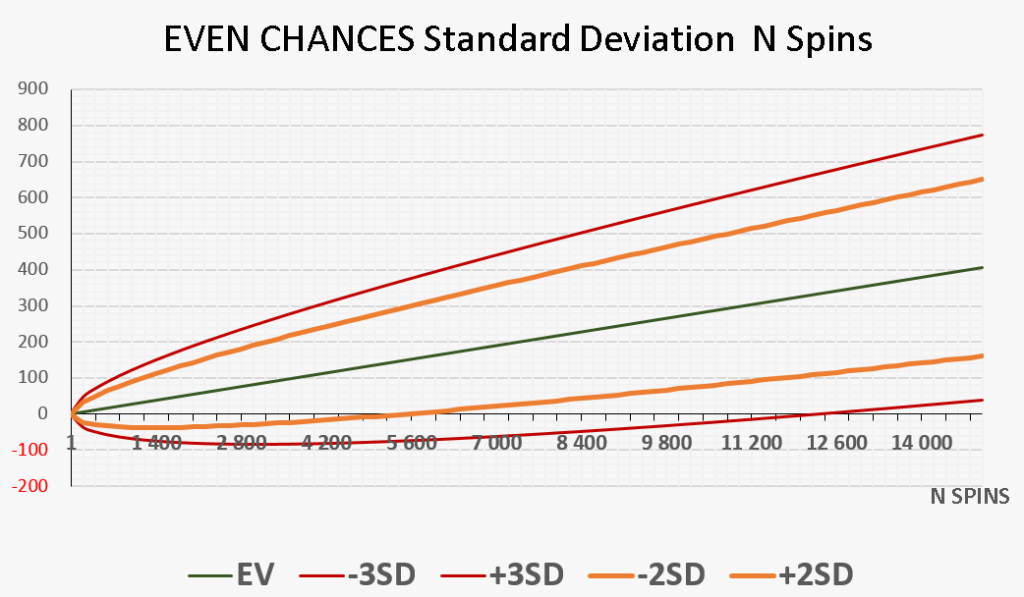
As the number of spins increases, EV grows in direct proportion to N: EV = Wager × N × (1/37). Standard deviation grows only in proportion to the square root of N: SD = SD₁ × √N. The ±3σ band captures 99.73% of all actual outcomes, while the ±2σ band captures 95.45%.
In absolute terms, EV outpaces SD over time. In relative terms, the house edge per spin stays fixed at 2.7% (1/37) regardless of bet size or the number of spins played. Standard deviation as a percentage, however, shrinks steadily and converges toward EV as N grows. The longer the game runs, the tighter actual results cluster around the mathematical expectation.
Short-Run Risk vs. Long-Run Certainty
The EV and SD charts show that despite the house always having a positive expected result, actual casino outcomes can dip below zero in the short run – the casino can and does lose. Straight Up is far more volatile than Even Chances: its single-spin SD is nearly six times higher (5.8378 vs. 0.9996).
For Even Chances bets, actual results enter entirely positive territory starting around 5,600 spins at 95.45% confidence (±2σ), and from about 12,400 spins at 99.73% confidence (±3σ). For Straight Up bets, the numbers are dramatically different: 190,000 spins at 95.45% confidence and 420,000 spins at 99.73%.
Standard deviation reflects the risk level of each bet and allows you to calculate the range of likely outcomes around the expected value for any number of spins at any chosen confidence level. To put concrete numbers on it: a casino spreading a $100 Straight Up bet over 1,000 spins can expect, with 99.73% confidence, a result somewhere between −$148,108 and +$202,162. The same $100 bet on Even Chances over the same 1,000 spins narrows the 99.73% range to −$6,781 to +$12,186.
Complete Bets: Maximum Variance
Complete bets represent the highest-variance play in Roulette. When a player places a complete bet on a number in the second column (5, 8, 11, 14, 17, 20, 23, 26, 29, 32), variance and standard deviation reach their maximum. In high-stakes play, the casino faces the risk of a significant loss that must be evaluated before the game begins, and betting limits must be set accordingly.
Complete 8 Breakdown ($100 chip)
A complete bet on number 8 costs 40 chips ($4,000 total).
| Payout | Numbers | Payout (x) | Probability (p) | xp | x²p |
|---|---|---|---|---|---|
| Lose | 0–12, 22–36 | −4,000 | 0.757 | −3,027 | 12,108,108 |
| Straight Up 8 | 8 | 39,200 | 0.027 | 1,059 | 41,530,811 |
| Split 7/8 | 7 | 3,200 | 0.027 | 86 | 276,757 |
| Split 8/11 | 11 | 10,400 | 0.027 | 281 | 2,923,243 |
| Split 5/8 | 5 | 3,200 | 0.027 | 86 | 276,757 |
| Split 8/9 | 9 | 3,200 | 0.027 | 86 | 276,757 |
| Corner 7/8/10/11 | 10 | 10,400 | 0.027 | 281 | 2,923,243 |
| Corner 8/9/11/12 | 12 | 3,200 | 0.027 | 86 | 276,757 |
| Street 7/8/9 | 16 | 17,600 | 0.027 | 476 | 8,371,892 |
| Six-Line | 18 | 17,600 | 0.027 | 476 | 8,371,892 |
| Totals | 37 | 1 | −108 | 77,336,216 |
EV = 108.1 per spin, D = 77,325, SD = 8,793.
The average expected result over N spins: EVN = (1/37) × Wager × N = $108.1 × N. Standard deviation scales as SDN = SD × √N.
Over 100 spins, the expected value is $10,811 – a mathematical average that will rarely materialize in that exact amount on such a short sample. The actual results of playing a complete bet on number 8 at $100 per chip over 100 spins will, with 95.45% probability, fall between −$165,058 and +$186,680, and with 99.73% probability, between −$252,992 and +$274,614.
Complete 8 ($100) – Dispersion Table
| Spins (N) | EV−3σ | EV−2σ | EV | EV+2σ | EV+3σ |
|---|---|---|---|---|---|
| 100 | −252,992 | −165,058 | 10,811 | 186,680 | 274,614 |
| 200 | −351,452 | −227,094 | 21,622 | 270,338 | 394,696 |
| 500 | −535,828 | −339,200 | 54,054 | 447,308 | 643,936 |
| 1,000 | −726,111 | −448,038 | 108,108 | 664,254 | 942,327 |
| 6,500 | −1,424,146 | −715,196 | 702,703 | 2,120,602 | 2,829,551 |
| 10,000 | −1,556,950 | −677,606 | 1,081,081 | 2,839,768 | 3,719,112 |
| 26,465 | −1,430,485 | 37 | 2,861,081 | 5,722,125 | 7,152,648 |
| 30,000 | −1,325,960 | 197,107 | 3,243,243 | 6,289,379 | 7,812,447 |
| 40,000 | −951,738 | 806,950 | 4,324,324 | 7,841,699 | 9,600,386 |
| 50,000 | −493,411 | 1,472,861 | 5,405,405 | 9,337,950 | 11,304,222 |
| 59,550 | 285 | 2,146,136 | 6,437,838 | 10,729,539 | 12,875,390 |
| 70,000 | 587,994 | 2,914,518 | 7,567,568 | 12,220,617 | 14,547,142 |
| 100,000 | 2,468,624 | 5,249,353 | 10,810,811 | 16,372,268 | 19,152,997 |
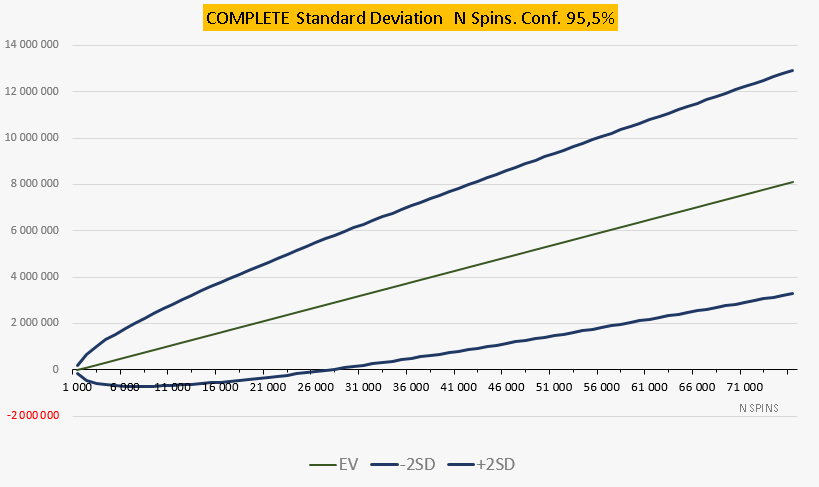
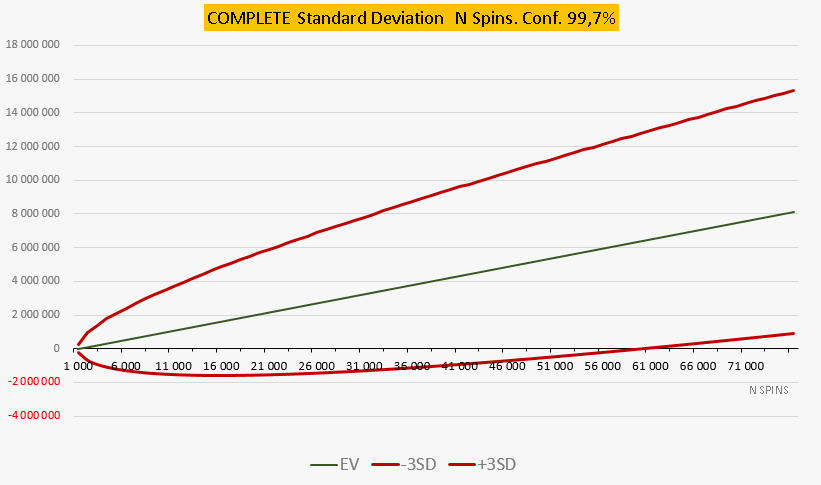
The casino can expect a positive result with 95.45% probability only after 26,465 spins, and with 99.73% probability only after 59,550 spins. At 1,000 spins, there is a 2.2% chance the casino loses more than $448,038.
Understanding the ±2σ Range
The probability that actual results fall within the ±2σ band is 95.45%. The lower bound of this band crosses zero at 26,465 spins. From that point on, the entire dispersion range sits in positive territory – meaning the casino can expect a positive outcome with 95.45% confidence. Before that point, negative results remain possible. At the 10,000-spin mark, results in dollar terms fall between −$677,606 and +$2,839,768. At 1,000 spins, there is a 2.1% probability (half of the 4.55% that falls outside ±2σ, since the distribution is symmetric) that the casino loses an amount in the range between −$677,606 and −$1,556,950.
Understanding the ±3σ Range
The probability that actual results fall within the ±3σ band is 99.73%. The lower bound crosses zero at 59,545 spins. From that point on, results are positive with 99.73% confidence. At 10,000 spins, the dollar range extends from −$1,556,950 to +$3,719,112. There is a 0.15% probability that the casino’s loss exceeds $1,556,950 at the 10,000-spin mark.
Complete bets are high-variance play that creates significant risk not only for the player but for the casino as well. When setting betting limits for complete bets, the casino must calculate potential losses and assess solvency risk over the short term.
In relative terms (as a percentage of total wagered), the dispersion charts for complete bets behave the same way as for any other Roulette bet. Expected value remains a flat 2.7% regardless of the number of spins played or the size of the bet. The SD percentage lines decay steadily: as the number of spins increases, the degree of dispersion decreases, converging toward the mathematical average of 2.7%.